One item to watch closely with this particular candlestick is the volume levels. If you market on your chart an area where the market may change and this candle appears with higher than usual volume, this could mean you are not the only one expecting this move. Higher volumes can indicate a higher interest in this market at that particular time and at those levels. Beyond that, you can look at standard deviation levels or other data points to help solidify your research. MacroAxis has many other tools and research instruments that can assist in narrowing your trading and investing methods.
RICKSHAW-MAN
| By Nathan Young | Macroaxis Story |
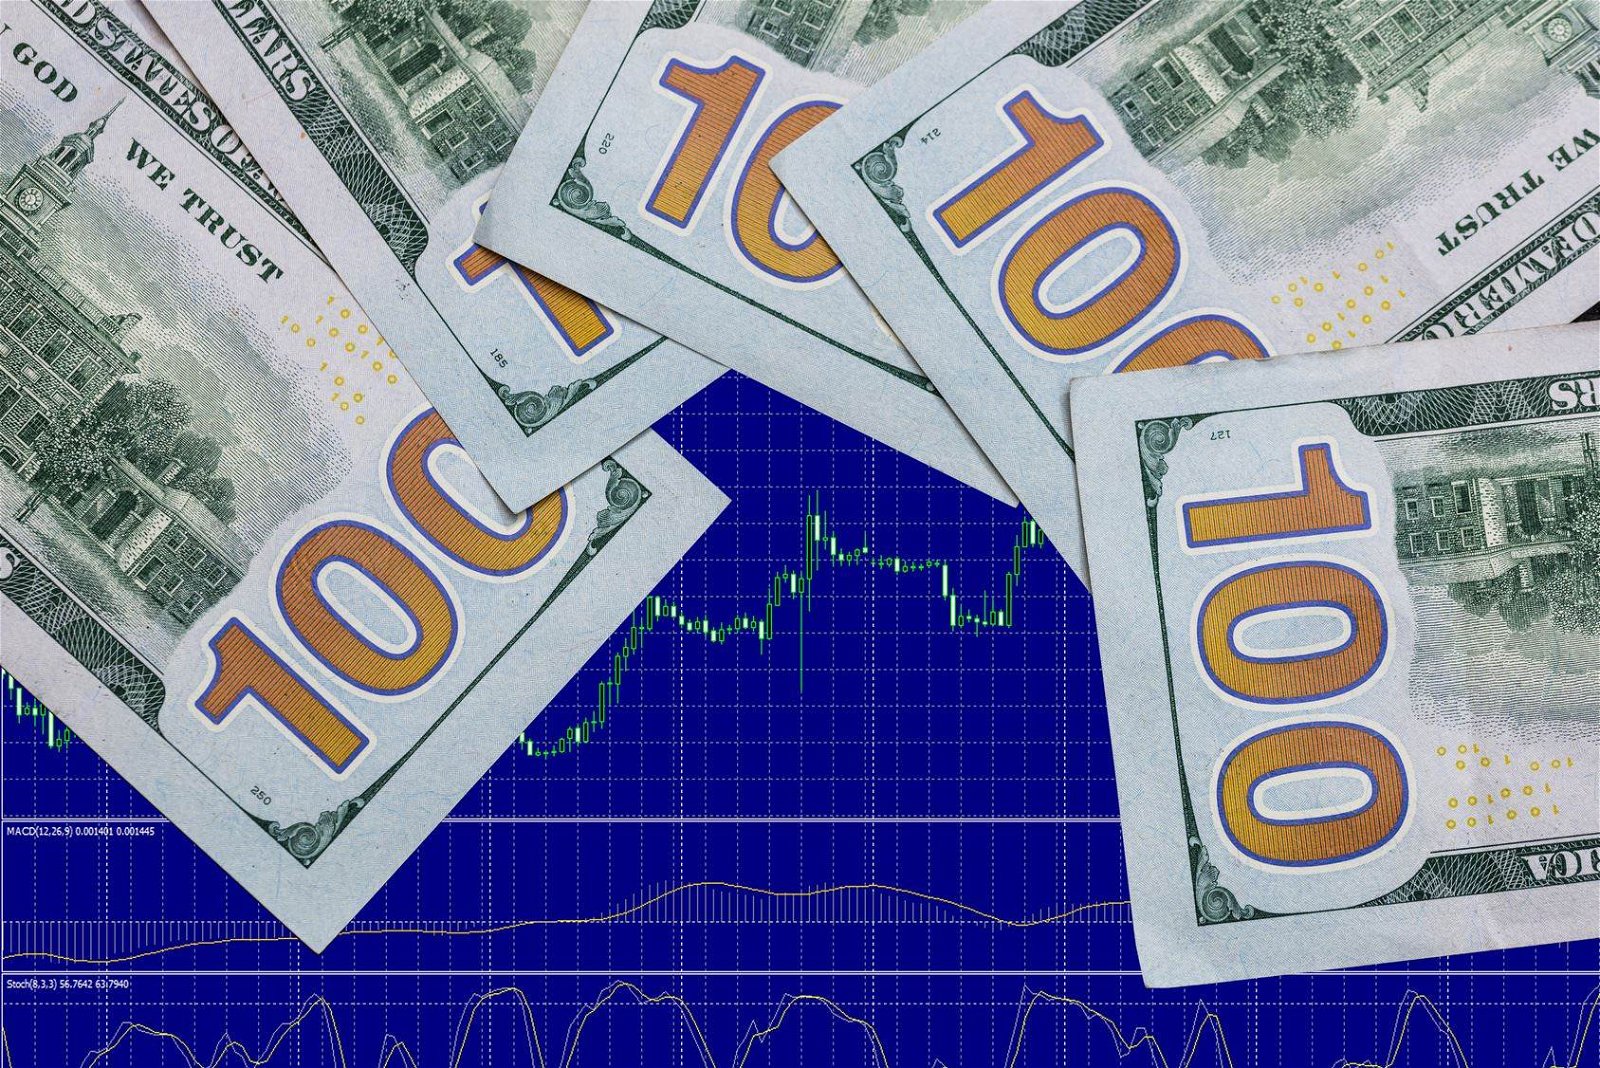
Candlestick patterns are a way technical analysis find points in the market where entry and exit may be ideal. For the Rickshaw Man, it is easy to distinguish among the other candles in the chart. It is one single candle that is similar to a doji or long legged doji, which you can read about here at MacroAxis. With that being said, let us dive into the structure of the candle.
Updated over a year ago View currently updated edicational stories | Filter RICKSHAW MAN |
Macroaxis uses a strict editorial review process to publish stories and blog posts. Our publishers support our company and may receive a small commission when the partner links or references are utilized. Commissions do not affect the opinions or evaluations of our editorial team. The information our editors and media partners deliver is confidential and licensed for your sole use as a Macroaxis user. We reserve all rights to the content of this article, and therefore copying or distributing this story in whole or in part is strictly prohibited.
Reviewed by Rifka Kats
This is a single candle that has a long range and a tiny body. The wicks on both ends indicate there is indecision in the market and the nonexistent body means bears and bulls are unable to find an agreed upon price. Being an easy candle to find compared to others, this can allow the trader or investor to be alerted to potential market movements.
Building efficient market-beating portfolios requires time, education, and a lot of computing power!
The Portfolio Architect is an AI-driven system that provides multiple benefits to our users by leveraging cutting-edge machine learning algorithms, statistical analysis, and predictive modeling to automate the process of asset selection and portfolio construction, saving time and reducing human error for individual and institutional investors.
Try AI Portfolio ArchitectEditorial Staff
This story should be regarded as informational only and should not be considered a solicitation to sell or buy any financial products. Macroaxis does not express any opinion as to the present or future value of any investments referred to in this post. This post may not be reproduced without the consent of Macroaxis LLC. Please refer to our Terms of Use for any information regarding our disclosure principles.
Would you like to provide feedback on the content of this article?
You can get in touch with us directly or send us a quick note via email to [email protected]Did you try this?
Run USA ETFs Now
USA ETFsFind actively traded Exchange Traded Funds (ETF) in USA |
| All Next | Launch Module |
Check out Investing Opportunities to better understand how to build diversified portfolios. Also, note that the market value of any private could be closely tied with the direction of predictive economic indicators such as signals in estimate. You can also try the Portfolio Diagnostics module to use generated alerts and portfolio events aggregator to diagnose current holdings.
Other Consideration for investing
| Portfolio Comparator Compare the composition, asset allocations and performance of any two portfolios in your account | |
| Portfolio Anywhere Track or share privately all of your investments from the convenience of any device | |
| Sign In To Macroaxis Sign in to explore Macroaxis' wealth optimization platform and fintech modules | |
| Content Syndication Quickly integrate customizable finance content to your own investment portal | |
| FinTech Suite Use AI to screen and filter profitable investment opportunities | |
| Equity Forecasting Use basic forecasting models to generate price predictions and determine price momentum | |
| Volatility Analysis Get historical volatility and risk analysis based on latest market data |