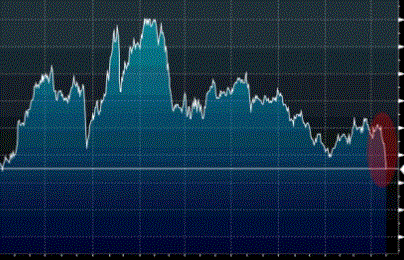
Smead Value Cash Position Weight vs. Annual Yield
| SVFDX Fund | USD 73.94 1.05 1.40% |
For Smead Value profitability analysis, we use financial ratios and fundamental drivers that measure the ability of Smead Value to generate income relative to revenue, assets, operating costs, and current equity. These fundamental indicators attest to how well Smead Value Fund utilizes its assets to generate profit and value for its shareholders. The profitability module also shows relationships between Smead Value's most relevant fundamental drivers. It provides multiple suggestions of what could affect the performance of Smead Value Fund over time as well as its relative position and ranking within its peers.
Smead |
Smead Value Fund Annual Yield vs. Cash Position Weight Fundamental Analysis
Comparative valuation techniques use various fundamental indicators to help in determining Smead Value's current stock value. Our valuation model uses many indicators to compare Smead Value value to that of its competitors to determine the firm's financial worth. Smead Value Fund is rated second largest fund in cash position weight among similar funds. It is rated top fund in annual yield among similar funds . The ratio of Cash Position Weight to Annual Yield for Smead Value Fund is about 386.18 . The reason why the comparable model can be used in almost all circumstances is due to the vast number of multiples that can be utilized, such as the price-to-earnings (P/E), price-to-book (P/B), price-to-sales (P/S), price-to-cash flow (P/CF), and many others. The P/E ratio is the most commonly used of these ratios because it focuses on the Smead Value's earnings, one of the primary drivers of an investment's value.Smead Annual Yield vs. Cash Position Weight
Percentage of fund asset invested in cash equivalents or risk-free instruments. About 40% of all global funds carry cash on their balance sheet.
Smead Value |
| = | 5.87 % |
Funds or ETFs that have over 40% of their value invested in low-risk instruments or cash equivalents typically attract conservative investors.
Yield generally refers to the amount of cash that is paid back to the owner of a security over a specific time (usually one year). It is expressed as a percentage of current market price, and usually amounts to all the interests and/or dividends paid over a given period. A higher yield allows the shareholders to generate returns on their investments sooner. However, investors should also be aware that a high yield may be a result of market turmoil or increased price volatility.
Smead Value |
| = | 0.02 % |
Small firms, start-ups, or companies with high growth potential typically do not pay out dividends or distribute a lot of their profits. These companies will have small yield. Alternatively, more established companies, ETFs, and funds that invest in bonds will have higher yields.
Smead Annual Yield Comparison
Smead Value is currently under evaluation in annual yield among similar funds.
Smead Value Profitability Projections
The most important aspect of a successful company is its ability to generate a profit. For investors in Smead Value, profitability is also one of the essential criteria for including it into their portfolios because, without profit, Smead Value will eventually generate negative long term returns. The profitability progress is the general direction of Smead Value's change in net profit over the period of time. It can combine multiple indicators of Smead Value, where stable trends show no significant progress. An accelerating trend is seen as positive, while a decreasing one is unfavorable. A rising trend means that profits are rising, and operational efficiency may be rising as well. A decreasing trend is a sign of poor performance and may indicate upcoming losses.
To achieve its investment objective, the fund will maintain approximately 25-30 companies in its portfolio and will invest in the common stocks of large capitalization U.S. companies. The funds manager considers large-cap companies to be those publicly traded U.S. companies with capitalizations exceeding 5 billion. It is non-diversified.
Smead Profitability Driver Comparison
Profitability drivers are factors that can directly affect your investment outlook on Smead Value. Investors often realize that things won't turn out the way they predict. There are maybe way too many unforeseen events and contingencies during the holding period of Smead Value position where the market behavior may be hard to predict, tax policy changes, gold or oil price hikes, calamities change, and many others. The question is, are you prepared for these unexpected events? Although some of these situations are obviously beyond your control, you can still follow the important profit indicators to know where you should focus on when things like this occur. Below are some of the Smead Value's important profitability drivers and their relationship over time.
Learn to be your own money manager
Our tools can tell you how much better you can do entering a position in Smead Value without increasing your portfolio risk or giving up the expected return. As an individual investor, you need to find a reliable way to track all your investment portfolios. However, your requirements will often be based on how much of the process you decide to do yourself. In addition to allowing all investors analytical transparency into all their portfolios, our tools can evaluate risk-adjusted returns of your individual positions relative to your overall portfolio.Did you try this?
Run Watchlist Optimization Now
Watchlist OptimizationOptimize watchlists to build efficient portfolios or rebalance existing positions based on the mean-variance optimization algorithm |
| All Next | Launch Module |
Use Investing Themes to Complement your Smead Value position
In addition to having Smead Value in your portfolios, you can quickly add positions using our predefined set of ideas and optimize them against your very unique investing style. A single investing idea is a collection of funds, stocks, ETFs, or cryptocurrencies that are programmatically selected from a pull of investment themes. After you determine your investment opportunity, you can then find an optimal portfolio that will maximize potential returns on the chosen idea or minimize its exposure to market volatility.Did You Try This Idea?
Run Market Neutral Funds Thematic Idea Now
Market Neutral Funds
Funds or Etfs that invest in both long and short positions of different entities to enhance returns from broad market movements over time. The Market Neutral Funds theme has 40 constituents at this time.
You can either use a buy-and-hold strategy to lock in the entire theme or actively trade it to take advantage of the short-term price volatility of individual constituents. Macroaxis can help you discover thousands of investment opportunities in different asset classes. In addition, you can partner with us for reliable portfolio optimization as you plan to utilize Market Neutral Funds Theme or any other thematic opportunities.
| View All Next | Launch |
Other Information on Investing in Smead Mutual Fund
To fully project Smead Value's future profitability, investors should examine all historical financial statements. These statements provide investors with a comprehensive snapshot of the financial position of Smead Value Fund at a specified time, usually calculated after every quarter, six months, or one year. Three primary documents fall into the category of financial statements. These documents include Smead Value's income statement, its balance sheet, and the statement of cash flows.
| Equity Forecasting Use basic forecasting models to generate price predictions and determine price momentum | |
| Portfolio Anywhere Track or share privately all of your investments from the convenience of any device | |
| Bond Analysis Evaluate and analyze corporate bonds as a potential investment for your portfolios. | |
| Risk-Return Analysis View associations between returns expected from investment and the risk you assume |